2015 The Year Of The Infographic: The Benefits Of An Infographic And How It Can Help Your Business
An Animated Infographic is a representation of information in a graphic format, for example a interactive chart or a diagram which is designed to make the data easily understandable. Here at Bliink we advise our corporate clients to use infographics to quickly communicate a message, to simplify a presentation with large amounts of information or to see data patterns and their relationships . Infographics work as informative content and are a very effective way of digitally marketing your product or website. Animated Infographics normally include an appealing subject that is aimed at the correct target audience. With engaging content, it must be visually attractive and exciting.
A report from Neoman found that good quality infographics are 30 times more likely to be read than any article or post (this is because 90% most of the information transmitted to your brain is visual). Here at Bliink we have found that our clients who use infographics on their landing page have found an increase of 12% on their bounce back ratio. However the best thing about our infographics is that any company can use them, from insurance companies to utilities companies. With this year alone the term infographic being searched 13 million times on Google.
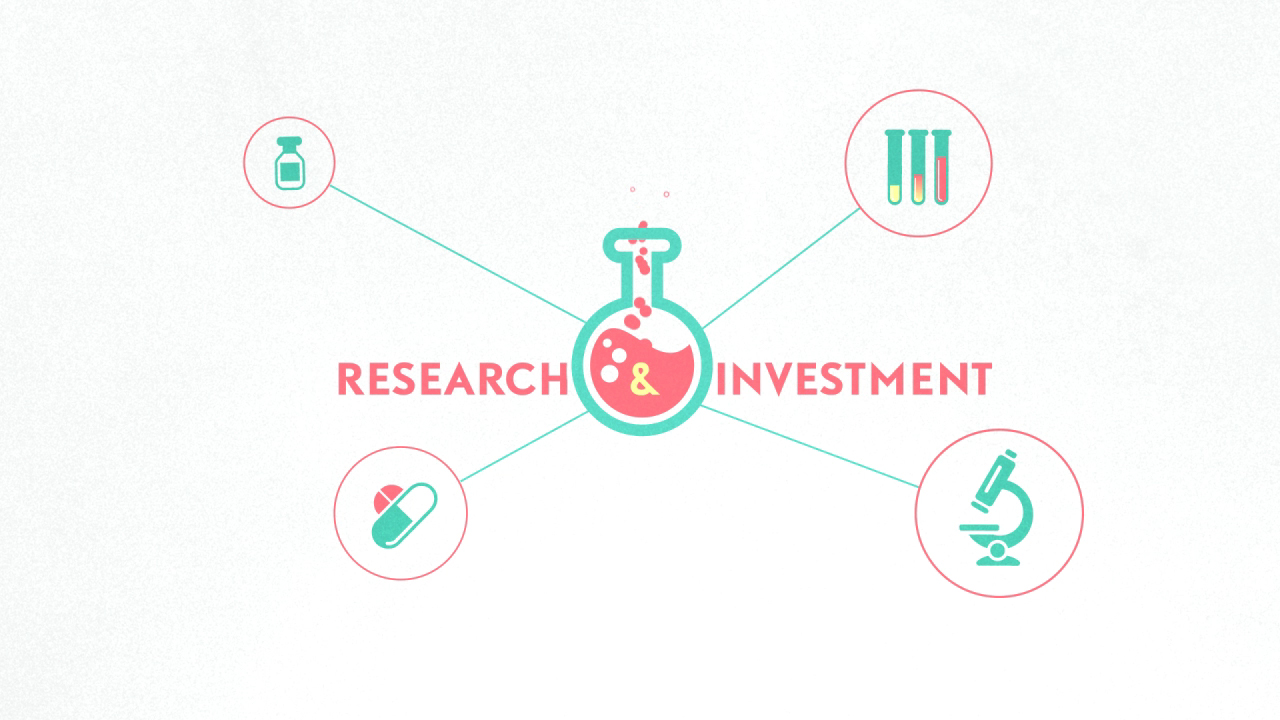
See below for an example of one of our recent Animated Infographics.
Benefits of creating an infographic
As mentioned before the greatest benefit of an animated infographic is that it makes information simple, logical and engrossing for whoever is watching them. Our clients love the straight-to-the-point facts with bespoke visuals.
Another benefit of using an animated infographic for your website is its combination with search engine optimisation and its potential to go viral. Bliinks engaging infographics make people want to share your site, thus Google will show your website higher in its internal ad ranking system. Thus an infographic is a great way to boost & increase your brand awareness, one of the ways Bliink does this is by embedding your logo and brand into the animated video, so that it represents your company always.
You can measure the search engine optimisation by the increase in inbound links using Google Webmaster Tools. On your social media sites, you can see the increase of followers and sharing of the infographic. On Twitter you can use the ‘twitter for business’ to measure this.
Please check out our Infographics page for some more examples


